


Making high-value decisions can be as simple as answering a binary question, "Yes or no?" Many decisions, however, are more complex and include multiple moving parts. Our brains have a limited capacity for such complexity, especially when time constraints apply to the decision. Today, we will look at several methods designed to simplify exploring complex decisions using graphic visualization techniques.
I am a visual and tactile learner. Even in the most straightforward conversations, my brain has difficulty sorting and cataloging complex information if I use only my ears. For those who know me, I'm sorry if I ever forgot something you told me. Knowing this in college would have improved my life (and grades)!
These days, I'm a tried and true note-taker in meetings; sometimes, I will use my computer, but more than likely, you'll see me using a legal pad and ink pen. The resulting notes would not make much sense to anyone but me. Often, my scribbles include keywords, arrows, boxes, quotes, quotation marks, and other elements that help my brain set the conversation in visual space. This is neuroscience at work. For me, this works well, but I cannot assume others would have the same result.
In business and nonprofits, we must understand that every gathering represents opportunities for many ways of thinking. Sure, there are people like me, but some also need verbatim notes in complete sentences to retain what they have heard. Others are thrilled to let their ears do all the work and can maintain it all. These people will forever provide me with a sense of mystery. We are all different this way.
Then, there's the issue of input diversity, as discussed in Part 5. Science tells us that diverse opinions are vital to understanding a question or problem completely. Diverse teams are also more accurate, less biased, and more creative overall. Besides providing a visual record, graphic visualization can also be a valuable tool for supporting diverse points of view. (Rock, 2011)
Graphic visualization can transform abstract ideas into clear, tangible images. Whether you're mapping out strategies, planning meetings, or just trying to explore potential outcomes, graphic visualization methods can be a game-changer. This post will explore popular techniques like outlining, graphic facilitation, The Implications Wheel™, mind mapping, and more. We'll also see how these methods connect with brain science, neuroscience, and psychology to help our brains catalog and understand what we're considering.
Why Visualize Your Decisions?
Our brains process visual information more efficiently than text alone. We are hardwired that way. According to dual coding theory (Paivio, 1986), when ideas are encoded visually and verbally, they're more likely to be retained and understood. Graphic visualization helps clarify complex ideas and engages multiple neural pathways, leading to deeper insight and more robust decision-making. As Daniel Kahneman explains in Thinking, Fast and Slow, engaging our slower, more deliberative System 2 helps counteract the snap judgments of our intuitive System 1. (Kahneman, 2010)
Popular Visualization Methods for Decision-Making
Let's summarize some of the most common and effective methods to visualize decision-making and explore potential outcomes.
1. Outlining
Almost everyone reading this has used outlining at some point. It's still taught as early as junior high school. Outlining is a straightforward method where you structure your ideas hierarchically. While text-based, it hints at the power of using form and structure when imagining complex issues. This technique is beneficial for breaking down a decision into its key components. You create a clear roadmap of the decision process by organizing your thoughts into main ideas and supporting details. Outlining can help highlight priorities and ensure that nothing important gets overlooked.
2. Mind Maps
Mind maps are a dynamic way to represent ideas and their visual interconnections. Popularized by Tony Buzan in The Mind Map Book (Buzan, 2006), this technique uses a central concept surrounded by branches representing related ideas. Mind maps encourage free association and creative exploration, making them excellent for brainstorming and exploring potential outcomes. They also facilitate a non-linear way of thinking, closer to how our brains naturally store information. I've used numerous smartphone and computer apps that make mind mapping easy and fun.
3. Graphic Facilitation
Graphic facilitation involves using visual elements—such as drawings, icons, and diagrams—to capture ideas during meetings or planning sessions. Professional facilitators often act as "visual recorders," translating discussions into real-time graphics everyone can see and engage with. This method keeps participants focused and makes abstract ideas more concrete. In my hometown of Traverse City, Michigan, local artists like Lindy Bishop and Penny Kreibel provide their artistry to capture conversations. In addition to the live aspect of graphic facilitation, where a visual synopsis grows as the meeting progresses, many of the outputs of visual facilitation have long lives on the walls and in the hallways of the organizations using them. National experts like David Sibbet have championed graphic facilitation to unlock creative potential and ensure all voices get heard in a discussion.
4. The Implications Wheel™
We covered Joel Barker's The Implications Wheel™ in Part 5 of this series. The Implications Wheel™ is a structured tool used to explore the ripple effects of a decision or event. You start by placing a central idea in the middle, drawing spokes representing immediate implications, and then branch out to show secondary and tertiary consequences. This layered visualization helps uncover long-term impacts and unintended outcomes, encouraging a more comprehensive view of potential scenarios. While its intention is not as a graphic visualization tool, its output is satisfying and makes complex explorations of ideas easy to understand.
5. Systems Thinking Approach
A compelling method for visualizing decision-making is the Systems Thinking approach. Systems thinking is a holistic methodology that encourages us to view decisions as part of a broader, interconnected system rather than as isolated events. It involves mapping the relationships, feedback loops, and interdependencies among various problems, processes, or idea elements.
Tools such as causal loop diagrams, systems maps, and stock-and-flow diagrams are integral to this approach. These visual tools help us understand how different factors influence one another over time, revealing dynamics that might otherwise remain hidden. Systems thinking not only aids in identifying leverage points for intervention but also helps anticipate unintended consequences of decisions.
This method is deeply rooted in neuroscience and psychology. Research suggests that multiple brain regions are activated when considering complex systems, fostering integrative thinking that bridges analytic and creative processes. In his seminal work The Fifth Discipline, Peter Senge (Senge, 2006) emphasizes how systems thinking transforms organizations by revealing the underlying structure of problems and encouraging proactive rather than reactive decision-making. By adopting a systems perspective, we can better counter cognitive biases and develop a more comprehensive understanding of short-term and long-term impacts.
The nonprofit community in Traverse City, Michigan, is making systems thinking an integral part of high-performing organizations. Funding institutions like the Rotary Charities provide advisory support to teach and implement systems thinking. Two of my colleagues, Brittany Vanderbeek and Nick Beadleston, are deeply engaged in consulting, training, and leadership roles that make systems thinking part of the entrepreneurial ecosystem. Learn more at Brittany's website, https://www.illuminateopportunity.com, and Nick's at https://www.groveincubator.org/.
6. Other Techniques: Flowcharts, Gantt Charts, and Storyboards
In addition to the methods mentioned above, other popular graphic visualization tools include:
Flowcharts: Ideal for mapping out decision processes and identifying key decision points.
Gantt Charts: Provide a timeline view of projects, helping track progress and deadlines.
Storyboards help visualize events or scenarios, especially when planning complex projects or predicting outcomes.
Action-based Calendars: Large calendars can be very effective and simple tools to help organizations display their ideas and create mutual accountability.
Newly emerging digital tools that use AI: The digital landscape is moving fast. Many tools are available and emerging that I haven't listed here yet. Do some of your own sleuthing.
How Visual Thinking Engages Our Brain
Visualizing ideas isn't just a creative exercise—it's a powerful cognitive tool. Neuroscience research shows that visual processing engages the occipital lobe, which boosts memory retention and improves comprehension. (That works like magic for me!) Converting text-heavy information into visual formats effectively reduces cognitive load, making it easier for our brains to analyze and store complex information.
Moreover, visual tools help counter inherent cognitive biases by presenting information in a balanced, holistic format. When you use mind maps or graphic facilitation, you're encouraged to explore multiple perspectives and interconnections. This broader view can help offset biases such as confirmation bias, which might otherwise narrow our focus.
Psychologically, visual strategies can also enhance creativity and innovation. Seeing relationships between ideas graphically represented opens up new pathways for problem-solving. This is why many successful companies and thought leaders integrate visual strategies into their decision-making processes—bridging the gap between our brains' analytical and creative sides to foster more well-rounded, informed decisions.
Finally, graphic visualization tools provide an effective alternative to text-based records of decision-making and planning processes. As a business consultant, I have seen too many strategic plans locked up in looseleaf binders on the shelves of C-suite leaders. The documents are awkward to access and challenging (read boring) to comprehend. Visual tools make your ideas and plans come to life for all involved.
Bringing It All Together
In today's fast-paced world, effective decision-making often hinges on our ability to see the big picture. By leveraging graphic visualization techniques—outlining, mind maps, graphic facilitation, the Implications Wheel™, or systems thinking—we empower our brains to process and integrate complex information more effectively. These methods enhance our understanding and encourage a more balanced approach to decision-making by engaging both the creative and analytical parts of our brains.
Combining visual tools and cognitive science offers a promising pathway to more precise, more strategic decisions. Research in neuroscience and psychology continues to underscore the importance of visual thinking, and embracing these techniques can give you a significant edge in both professional and personal contexts.
Next time you face a challenging decision, allow all of your brain to engage by using visual elements. You can transform complex decisions into clear, actionable insights by tapping into these graphic visualization techniques and understanding their science. Happy visualizing, and here's to making smarter decisions every day!
References
Kahneman, D. (2011). Thinking, Fast and Slow. Farrar, Straus and Giroux.
Buzan, T. (2006). The Mind Map Book: Unlock Your Creativity, Boost Your Memory, Change Your Life. BBC Active.
Paivio, A. (1986). Mental Representations: A Dual Coding Approach.
Rock, D and Grant, H. (2016) https://hbr.org/2016/11/why-diverse-teams-are-smarter
Senge, P (2006) The Fifth Discipline
Dual Coding Theory. https://www.instructionaldesign.org/theories/dual-coding/
For insights on systems thinking, see Peter Senge's The Fifth Discipline and additional information on Systems Thinking.
Stay Awesome!

http://www.predictivemastery.com/
As a result of my curiosity and a decade or so of research, I've recently launched a new project called Predictive Mastery. This program delves into the art and science of decision-making, where we peel back the layers of how we make decisions, what role our brains play, and how we can use this knowledge to be more confident in the future.
Predictive Mastery also explores scenario planning for large projects. For over two decades, I've helped businesses, governments, and universities apply rigorous approaches to build what-if scenarios. From imagining the potential of post-Katrina Louisana to working with the University of Notre Dame and the CDC to predict the implications of a possible H1N1 bird flu pandemic, structured scenario planning can reveal previously unimagined creative solutions. It dovetails perfectly with this work on decision-making and is now a crucial component of the Predictive Mastery workshop.
Our first Predictive Mastery workshop will be held on March 6, 2025, in Traverse City, Michigan. Click here to view the event page.
The program is in six modules.
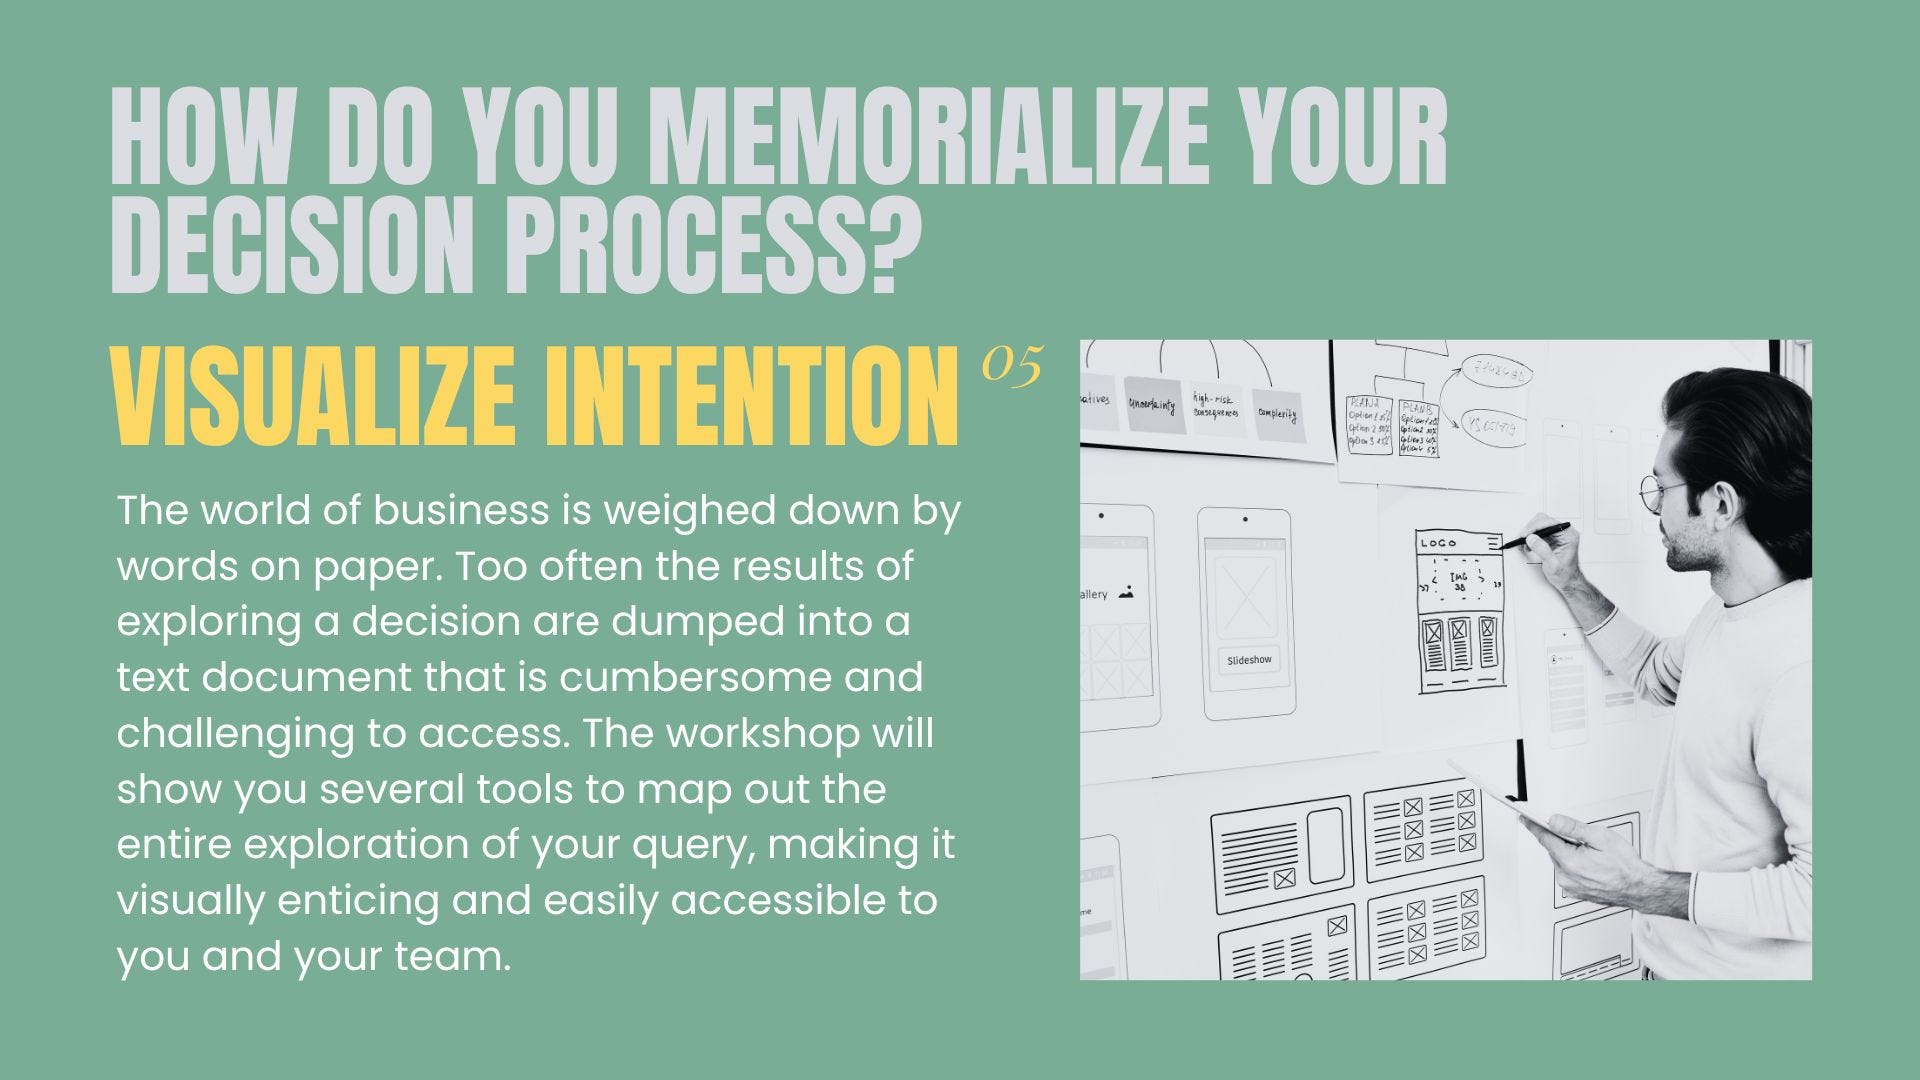
STEP 5: Visualize Intention
STEP 6: Create A Bias For Action
Find out more about Precision Mastery and my other programs on the website.